William O'Neil gives CANSLIM workshop (January 2010)

In this January 2010 workshop for the Chicago Naperville IBD Meetup, William O'Neil explains the market-timing rules behind CANSLIM—distribution days, follow-through days, and raising cash—and then reviews ten stocks his institutional service flagged around the March 2009 bottom. He reads each chart week by week, connecting support, tight closes, relative strength, and handles to earnings, sales, return on equity, and sponsorship. The closing Q&A covers hold rules, base stages, position sizing, and the discipline of following the system.
Books Mentioned
Key Insights
- Distribution days
- Five or six distribution days in roughly five weeks turn the market negative. Raise cash as they build; the amount depends on the stocks you hold.
- Buy the follow-through
- Ignore the first three days of a rally. On day four or later, a big-volume index gain is the green light—buy late that day even when the news is terrible.
- Support in the volume
- At a bottom, unchanged or smaller weekly closes on heavy volume mean institutions are absorbing supply. Three waves down exhaust the sellers.
- Relative strength leads
- The RS line often makes new highs weeks before the stock. That divergence marks the future leaders while the indexes are still falling.
- PE is an opinion
- Amazon at 43 times earnings and Green Mountain at 50 were buys because earnings, sales, ROE, sponsorship, and the story were right.
- A list is not a portfolio
- Eighty to a hundred names are a watchlist. Each week only two or three are at a proper buy point; weed the rest and focus on the potential leaders.
- Turn mistakes into rules
- The CertainTeed shakeout produced the rule: after a 20% gain in one to three weeks, hold through the first pullback for at least eight weeks.
- Sell three of four at 20%
- Buy exactly at the pivot, not after a chase. Take 20% on three of four positions and let the rare leader run.
- Don't deviate
- The rules were measured from a century of winners. Varying them, mixing systems, or blaming others is the expensive mistake.

How O'Neil reads a market top: distribution days
O'Neil opens with the S&P 500 and the days when volume rose while the index closed lower. Years ago three or four such distribution days were enough; the market's size has pushed the count to five or six within roughly five weeks. That cluster signals supply overwhelming demand, and history says the market rolls over. He does not try to predict the depth of the decline; he watches the trend and starts selling stocks and raising cash as the distribution builds, with the cash level depending on the stocks he owns.
Buy the follow-through, not the news
After a decline, O'Neil ignores the first, second, and usually the third day of a rally because any bounce can last a few days. From the fourth day he looks for a follow-through: a big volume increase and a major gain in the index. The news at that moment is usually terrible, which is why most people hesitate. He starts buying late on the follow-through day, because the biggest moves come from follow-throughs and the stocks that break out in the first one to three weeks are usually the leaders.
A 58% correction, deep bases, and the cost of whipsaw
The 2008–2009 decline was so steep that many growth stocks fell 60–90%, producing unusually deep cup-with-handle bases. O'Neil shows a current market that has rallied for almost a year but is now under distribution; he is selling some stocks and sitting with a few he believes in, including Apple. He accepts occasional whipsaws because the alternative—missing a follow-through—is worse. In a normal uptrend he would buy four to six stocks; after a whipsaw he buys only one or two, backs out if it fails, and waits for the next follow-through.
Why the leader service lagged in the 2009 rebound
Asked why his institutional leader service underperformed, O'Neil points to the character of the March 2009 bottom. The 58% decline over 17 months was the third-largest correction in about 125 years, an outright panic. Stocks that had sold at $50–70 fell to $1–4, and the percentage bounce from those levels was enormous. Value stocks therefore made progress first; growth stocks did not start to show until later.
The first chart: three waves down and heavy volume without progress
O'Neil introduces ten stocks from the service that were actionable around the March 2009 follow-through. The first is an unnamed stock modeled on Chrysler and Xerox in 1962. On the left side of a would-be cup, the stock falls in three waves. At the bottom, five consecutive weeks close unchanged on significant volume—heavy volume without further progress, which he reads as institutional support. It then rallies, rolls over, makes a second low, and later a third; after three waves, almost everyone who can be scared out has been.
The Livermore rule and the second buy point
On the daily chart O'Neil applies the old Livermore rule: if a $30 stock undercuts a low and then climbs back through it by three points, the move establishes a new buy point. For this roughly $90 stock he scales the threshold to about six points. The stock also shows four tight weeks near the low, a rally, and then a pullback where volume rises but the close falls less—another sign of support. Its relative strength line turns up before the market, and the stock then rises nine weeks in a row before forming a handle and a second buy point.
Netflix: a shallow cup and a relative strength line already at highs
Netflix formed a small cup with a handle, with its prior uptrend in the September 2008 quarter. The handle went sideways for two or three weeks on good volume. O'Neil stresses that none of these stocks had weak fundamentals: big earnings, big sales or high return on equity, sponsorship, and a story all aligned. Netflix held up better than most in the crash, and its relative strength line reached new highs long before the stock did—evidence it was bucking the market all the way down.
Amazon: support on the way down, then a PE of 43
Amazon came onto the service six days before the follow-through. On the left side, five red weeks carry rising volume, but the last two fall less than the prior week and the final red week has the highest volume without much price damage—institutional support. After a false follow-through and a new market low, the stock shows three unchanged weekly closes, then a pullback where volume dries up at the low. Enormous volume returns with closes at the weekly peak. The fundamentals show 149% earnings growth, 39% and 29% sales growth, and a 33% return on equity; the PE of 43 does not stop the buy.
Green Mountain Coffee: a PE of 50 and eight quarters of sponsorship
Green Mountain was not a deep pattern; it held up and reached new high ground early. Up weeks carry huge volume, and three or four tight weekly closes show accumulation. It came onto the service two days after the follow-through as it broke out of a cup with a handle. The fundamentals: earnings growth of 62%, 38%, and 97%, sales up 56%, return on equity 19% (he wants 17% minimum and 25–50% ideally), pre-tax margin 7%, and eight quarters of increasing mutual fund sponsorship. The PE was 50. O'Neil's point is that PE is a personal opinion; the earnings, sales, return on equity, and story are what matter. A tight three-week close after a run can be an add point, but he does not add more than his original position size.
Weeding 100 names down to Cerner—and the psychology of missing the bottom
The institutional service carried 80–100 names across two books. Each week only two or three were at or near a buy point, so the skill is weeding out the so-so charts and focusing on the potential leaders. Cerner is more conservative: three weeks tied at the left-side low, then five weeks down where volume rises and the third week closes well off its low—40% or more off the low is major support. Later the stock holds above its low while the market makes new lows, with tight closes and rising relative strength. O'Neil then explains why most people miss the first leg off a bear-market bottom: they are too scared to buy, wait for a pullback that never comes, and finally buy after the move.
VistaPrint: chart reading is a skill, and it takes practice
VistaPrint was a thin stock with strong numbers: annual growth of 44% and 51%, last two quarters up 36% and 66%, sales up 44% and 32%, and a solid return on equity. O'Neil uses it to make a broader point: reading charts is a learned skill, like playing the piano or basketball. You have to practice, study examples, and keep looking until the details become recognizable. There is no shortcut.
CREE: relative strength leads, and handles should drift down
O'Neil normally avoids semiconductor stocks because they are twice as volatile, but CREE was acting better than the others off the bottom and had actual earnings: five straight up quarters, the last two up 50% and 43%, sales up 24%, pre-tax margin 12%, and a PE of 41. The relative strength line made a new high weeks before the stock broke out. He points to the black weeks—he calls them skyscrapers—where volume was above average, showing accumulation for weeks. The handle drifted down, which is what he wants; a handle drifting up along the lows is a warning.
Priceline: a violent divergence and a third-phase warning
Priceline shows the same support pattern at the bottom: three tight weeks, a high-volume up week, and a pullback on lighter volume. Then, while the averages make new lows in February, the stock moves up against the market on huge volume. It breaks out with earnings up 48%, 99%, and 48% in recent quarters, the last quarter up 34%, and a 44% return on equity, in the middle of a 17-month bear market and a recession. O'Neil notes the phases of a breakout: the first works, the second often works, but a third-phase breakout is obvious and more likely to fail. After the stock doubles, some institutions start trimming.
Baidu: a violent leader bought at $200
Baidu corrected about 70%—more than the S&P's 58%—and was extremely volatile. At the bottom it found support on a heavy black week, drifted down on lighter volume, and turned up. It then rose nine weeks in a row, most weeks closing near the peak, before O'Neil and his team recognized the steady institutional buying. They put it on the service at $200. It kept closing at weekly peaks for perhaps 12–15 weeks before its first down week, then formed a handle where the second red week fell less than the first and closed in the upper part of a tight range on higher volume.
Ctrip: looking for the top one or two percent
Ctrip shows the same supply-and-demand signature: heavy volume on up weeks, closes near the weekly peak, tight areas during consolidation, and a proper handle. The fundamentals are exceptional—rapid earnings growth across recent quarters and years, last-quarter sales up 21%, return on equity 35%, and pre-tax margins of 46%. O'Neil's point is that the target is the top one or two percent of stocks; a 50-name list may contain only two, three, or four real leaders.
Express Scripts: buying the false breakdown
Express Scripts held up through the 58% correction because of a consistent record: 88% return on equity, rising pre-tax margins and ROE for eight years, and eight quarters of increased fund sponsorship. On its final break it undercut the January low around $49.50 but did not go down substantially. When it climbed back through that low by three points—around $52.50—O'Neil bought. The Livermore formula says the recovery through the old low proves the breakdown was false and establishes a new uptrend and a buy point.
Patterns repeat, and deep cups are justified by deep corrections
O'Neil's closing lesson from the ten charts: study as many models as you can. Patterns repeat because the market is supply and demand and big professionals—mutual funds now, JP Morgan's pools in 1910—create them. He says the firm has 125 years of patterns. The deep cups that confused people in this cycle were made by the 58% correction; the worse the correction, the deeper the base. The characteristics are the same, just a bigger cup with a handle, and buying came off the rounding bottom because few stocks were at a conventional breakout point.
Tools and the study method: annotated charts and MarketSmith
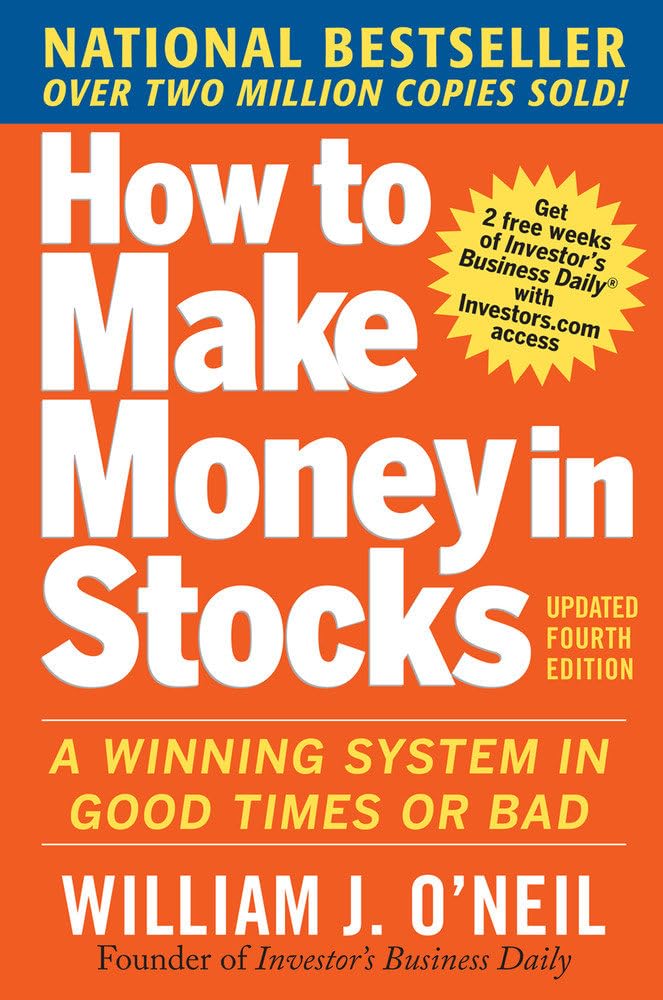
O'Neil recommends a chart service—Daily Graphs, about to be renamed MarketSmith—and a chart book. Build models from past winners and study them. The newest edition of How to Make Money in Stocks opens with 100 annotated charts from 1880 to the present, with page references that compare a 1925 RCA pattern to a 1965 pattern. The point is that very few people know patterns repeat, and the details—a handle wedging up, adverse volume in the wrong place—are what separate a real base from something that only looks like one.
Read the book three or four times—and review every trade
O'Neil tells the audience to get How to Make Money in Stocks and read it three or four times; a single pass will not stick because there are too many patterns and details. Newcomers should read the first chapter, reread it, take notes, and not move on until they understand it. The second discipline is an annual review: for the first two or three years, go back through every trade, post the charts, mark buys and sells in red, separate the winners from the mistakes, and study the one that got away. The goal is to write a new rule for the situation you mishandled.
The CertainTeed mistake and the eight-week hold rule
O'Neil bought CertainTeed as it ran up, got shaken out in a big shakeout, did not buy it back, and watched it double. At year-end he studied the chart and found it had run up about 20% in two weeks. He turned the mistake into a rule: if a stock breaks out of a sound pattern and gains 20% in one, two, or three weeks, hold it through the first normal pullback, which usually comes four to six weeks out—so hold at least eight weeks no matter what. A year later Syntex broke out at $100, ran 20% in three weeks, and the rule kept him in through a drop from the mid-80s to about $65; the stock then tripled in eight weeks.
Buy exactly, sell three of four at 20%, and act like a robot
O'Neil's execution rules: buy on the follow-through even if you get faked out, adding little by little rather than all at once. Buy exactly at the right point—not 5% or 10% after the breakout, where an 8% stop will throw you out. Sell three out of four stocks when they are up 20%, taking the short-term gain; only one or two in ten will be the big winners, and the market will tell you which ones by their action and earnings. Follow the rules strictly, ignore other services and analysts, and act like a robot.
Q&A: when the eight-week rule applies—Baidu and CREE
The first questions test the eight-week rule. Baidu broke out, but O'Neil says it looked like a growth stock even though it is cyclical, and he would not normally apply the rule there. CREE broke out in the week of October 9, rose 20% in three weeks, and the question is whether to sell after eight weeks. His answer: two pieces of evidence—three weeks of tight closes and accelerating earnings—say the stock deserves more time. If nothing else, hold it eight more weeks.
Q&A: a D grade is not a sell signal, and a list is not a portfolio
A listener asks why the index can carry a D distribution grade for two and a half months and still rally. O'Neil says a D is not a sell signal by itself; an E (heavy distribution) would concern him more, but a D can be normal. The next question asks why the institutional leader service lagged in 2009. His answer: the service is a list of 50–100 names, not a buy list. You have to sort through and buy the three, four, or five with the best price action, patterns, and earnings. Many of the year's big winners were thin stocks with 100,000–400,000 shares trading that made violent moves; good chart readers could make 70–90%, others 25–30%, and beginners 5–15%.
Q&A: know the company and the rules backwards and forwards
On earnings season and Regulation FD, O'Neil says he does not like going into earnings because it is guesswork. The defense is to know the company backwards and forwards—product, expectations, chart, earnings, growth—so you can sit through the fear. The next question asks whether the huge deep bases and weaker earnings of this cycle justify deviating from CANSLIM. His answer is blunt: you don't deviate, period. Learn the rules and chart reading backwards and forwards, and study history. The rules are not his opinions; they were built by studying every stock that doubled or tripled each year, and they have produced 100%-plus years.
Q&A: true leaders and the Apple chart from 2004
Asked how to tell a true leader from a stock to take 20% on, O'Neil says true leaders have huge earnings and keep acting better than the rest; there will be only a few. Study the patterns of the best past winners and you will recognize them sooner. He then pulls up Apple in 2004: a perfect cup with a handle, with the December 2003 quarter rounding out the bottom, moving up, and drifting down into the handle. Apple's prior record was spotty, but the chart and two quarters of 100%-plus earnings were enough. The lesson: a big leader can be bought right off the chart.
Q&A: base stage, the 11-month bull, and distribution
A listener asks about second- and third-stage bases. O'Neil repeats the rule: the first base usually works, the second often works, and the third is riskier—some work, but more fail, so the stock has to be exceptional. On the bull market, he says they do not predict; they analyze as they go. Eleven months in, they thought the move could last a year and a half to two years from the March turn, and they may be starting an intermediate correction that lasts three to six weeks. Asked about recent distribution, he says they start raising cash, with the amount depending on the stocks held.
Q&A: don't venture from CANSLIM
Asked how far from strict CANSLIM parameters an investor can go and still succeed, O'Neil calls himself narrow-minded and says the more you vary, the worse off you are. He compares the discipline to music, medicine, and athletics: a shortstop has to execute the double play exactly right, and small deviations cost the out. Investors should not veer into point-and-figure, candlesticks, or a pile of other services. The rules are not beliefs; they were measured against every model, and they are what the successful stocks had in common.
Q&A: most whipsaw is caused by buying wrong
A listener says his main problem is overtrading and whipsawing. O'Neil's diagnosis: go back and look at where you bought. Did you buy exactly at the pivot or off the 10-week line, or were you chasing 10–15% above a sound area? If you chase, you will get whipsawed. The fix is preparation: go through a chart book on the weekend, write down the names near a buy point and the exact price, and be there when it triggers—even at work, with an alert. Check sponsorship, volume, return on equity, and whether the stock is the leader in its industry.
Q&A: losing money early is normal—learn from it
An audience member admits he has lost money since starting with CANSLIM in October 2003. O'Neil tells him not to get discouraged and tells a story about one of his own portfolio managers, who was up 95% last year. In his first year, the young analyst found an earnings estimate he thought was valuable, put almost everything he had—three or four thousand dollars—into a $6 stock, watched it fall to $3, panicked, sold at a 50% loss, and then saw the company go bankrupt. Everyone goes through it. The response is to make the mistakes, write them down, plot them on a chart, and derive one or two new rules.
Q&A: what separates winners from losers, and why the rules don't change
Asked what separates people who succeed with the system from those who fail, O'Neil says you have to look at yourself. You cannot blame the broker, your wife, your girlfriend, or your brother; you have to study where you bought and sold and whether you followed the system. Learn through trial and error and turn your weakness into a strength. The final question asks whether portfolio rules should change by stock type. No: there is no reason to lose more than 8%, and with skill the average loss should be 5–6%. The rules came from a thousand models; earnings should be up at least 20%, return on equity ideally 25–50%, and margins can substitute when ROE is low.